
Staring at performance dashboards and feeling like the numbers just don't tell the whole story? It’s a common frustration. You see the data, but it doesn’t capture your team's real-world effort, ingenuity, or collaborative spirit. Here's a quick win: stop trying to measure everything. Instead, focus on defining 2-3 key metrics that your team agrees truly reflect high-quality work. This simple shift moves the focus from busywork to genuine impact.
This guide provides actionable, step-by-step guidance to help you build a performance measurement system that your team will actually buy into.
Moving Beyond Meaningless Performance Metrics
To get this right, we need to ditch the old-school, one-dimensional metrics that don't serve us anymore. Think about it: measuring team performance is really about balancing the final results (the outcomes) with the journey to get there (the behaviors and quality).
A big part of this is understanding leading vs. lagging indicators for performance. Grasping this difference is fundamental. It's what allows you to build a measurement system that can actually predict future success, not just report on what’s already happened.
Step 1: Blend Quantitative and Qualitative Data
If you're only looking at the numbers—like how many tasks someone completed—you're getting a dangerously incomplete picture. An overemphasis on pure output can unintentionally push your team toward speed over quality, which is a fast track to sloppy work and burnout.
Modern performance tracking digs deeper. Instead of just noting whether a goal was met, it asks more nuanced questions. How challenging was that goal? What was the quality of the final result? This balanced view requires you to bring qualitative data into the mix.
A team that hits 100% of its targets but is completely burned out and has a toxic culture isn't a high-performing team. It's a team on the verge of collapse. True performance measurement must account for team health and sustainability.
This image shows exactly what I mean. It illustrates how blending different metrics—like productivity, goal completion, and feedback frequency—gives you a much richer snapshot of what's happening within your team.
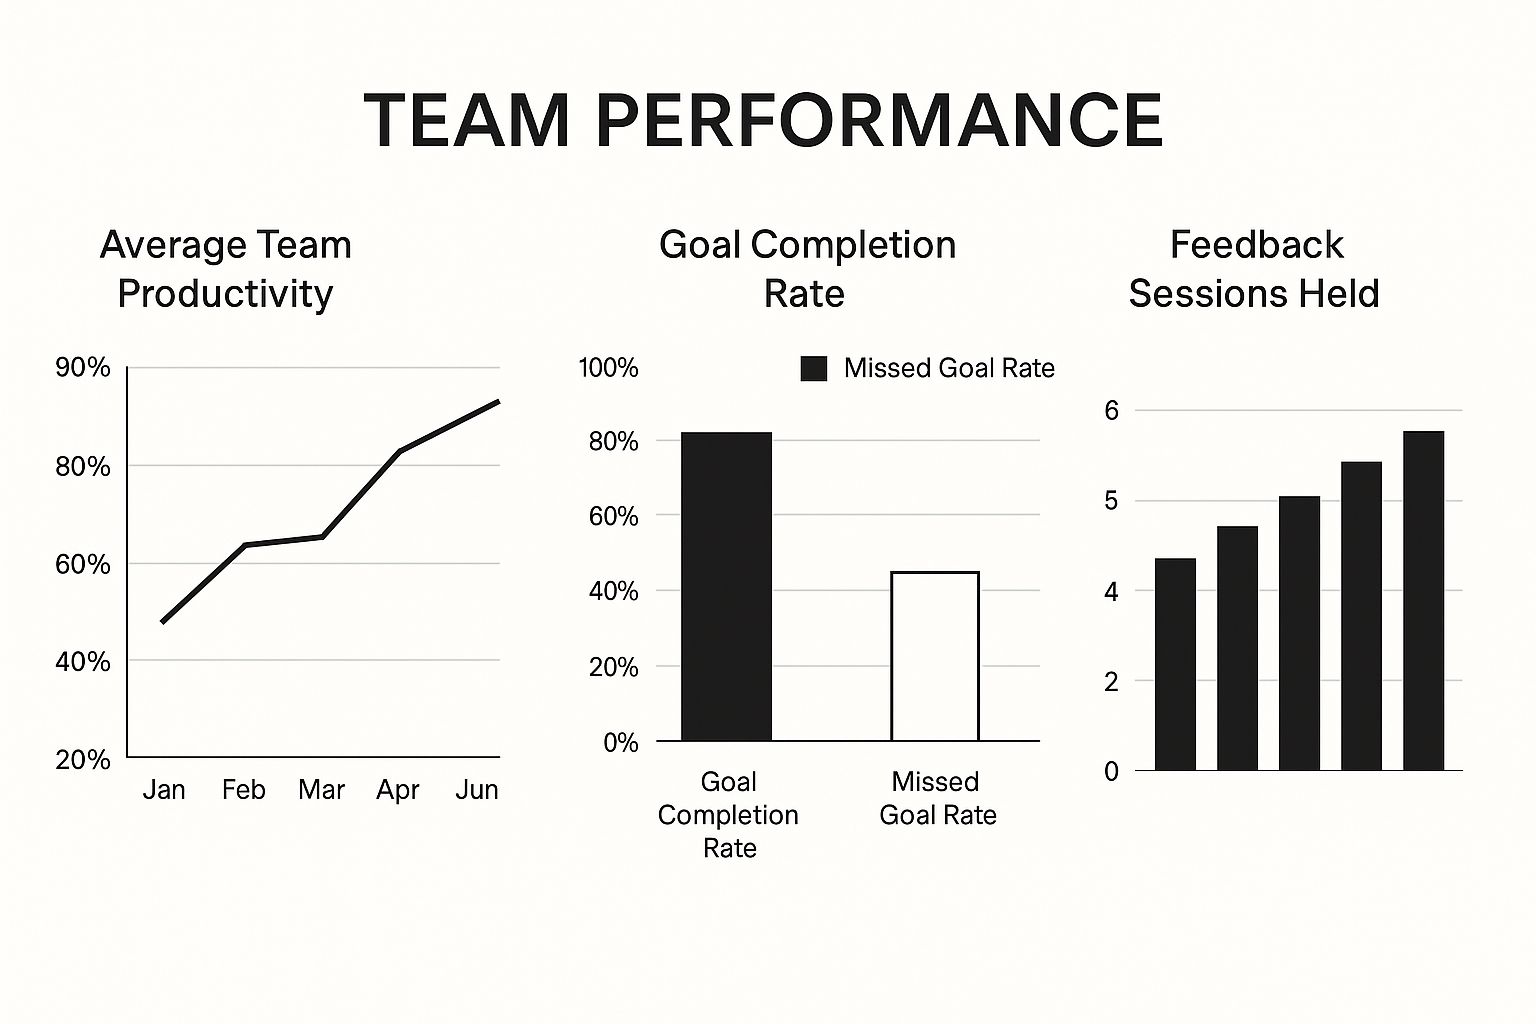
You can see that even if raw productivity dips, consistently high goal completion and frequent feedback are signs of a healthy, resilient team that can weather challenges.
To truly overhaul your approach, it's helpful to see what a "before and after" looks like. Many teams are stuck using outdated metrics simply because it's what they've always done.
Step 2: Swap Outdated Metrics for Impactful KPIs
Outdated Metric | Modern KPI | Why It's Better |
|---|---|---|
Number of Tasks Completed | Goal Completion Rate with Quality Score | Prioritizes impactful work and craftsmanship over just being busy. Discourages cutting corners. |
Hours Logged | Project Velocity or Cycle Time | Measures efficiency and the actual pace of progress, not just time spent at a desk. |
Individual Sales Quota | Team-Based Revenue Goals & Customer Satisfaction (CSAT) | Fosters collaboration and focuses on long-term customer relationships, not just transactional wins. |
Error Rate (Standalone) | First-Time-Right (FTR) Rate & Time to Resolution | Provides a fuller picture by measuring both initial quality and the team's responsiveness in fixing issues. |
This shift isn't just about swapping one number for another; it's about changing the conversation and what you value as a team. Adopting these more modern KPIs helps align everyone around what truly drives success: quality, efficiency, teamwork, and customer happiness.
Pro Tip: Conduct a Metric Audit
Before you rush to add a bunch of new KPIs, take a moment to audit what you’re already tracking. Get your team involved and ask them directly about each metric:
"Does this number actually help us make better decisions?"
"Does it accurately reflect our effort and our impact?"
If the answer is a resounding "no," it's time to let it go. Decluttering your performance dashboard is just as important as adding to it. You want to be sure that every single metric you track serves a clear purpose and helps drive meaningful action.
Defining What Success Looks Like for Your Team
 Does this feel familiar? You're tracking team performance, but the metrics feel… off. They were probably handed down from on high and don't quite capture what your team actually does. It's a classic disconnect that breeds confusion and makes goals feel arbitrary.
The solution is to define what success means with your team, not just for them. When people help build the yardstick, they’re genuinely invested in measuring up. You can't hit a target you can't see, so the first real step is getting everyone on the same page about what a "job well done" truly looks like.
Step 3: Run a Collaborative Goal-Setting Workshop
The best way to get this done is through a team workshop. This is a hands-on, collaborative session designed to nail down your team's core purpose and figure out how to measure its impact.
Kick things off with these foundational questions:
Why do we exist? What's the unique value our team brings to the company?
Who are we serving? Think about other departments, actual clients, or end-users.
What do they need from us to succeed? What outcomes are they counting on?
These questions shift the focus from a simple task list to genuine purpose. Once that's clear, you can start brainstorming metrics. A solid approach is to find a healthy mix of leading and lagging indicators.
Leading Indicators: These are your forward-looking metrics. They track the activities and inputs that drive future success. Think of things like the number of proactive client check-ins or the percentage of code covered by automated tests.
Lagging Indicators: These are your rear-view mirror metrics. They confirm whether your past efforts paid off. Customer satisfaction (CSAT) scores and final project profitability are perfect examples.
Focusing only on lagging indicators is like trying to drive by looking in the rearview mirror. It tells you exactly where you've been, but it’s useless for seeing the curve up ahead. You need a balance of both to manage performance proactively.
Mini Case Study: From Code-Counting to Quality Shipping
I once worked with a software development team whose morale was in the gutter. Why? They were being measured almost entirely on a single metric: lines of code written. This unintentionally incentivized developers to write bloated, clunky code just to hit their numbers, which naturally led to more bugs and agonizing deployment days.
We threw that metric out in a workshop. Instead, the team decided to own two new KPIs:
Cycle Time: The total time from starting work on a feature to getting it into production.
Bug-Free Deployment Rate: The percentage of deployments that didn't need an immediate hotfix.
The change was night and day. Their cycle time dropped by 30%, and their deployment success rate climbed to a staggering 98%. But more importantly, the team was happy. They were being judged on the quality and efficiency of their work—the stuff they actually cared about. They weren’t just writing code anymore; they were shipping valuable, stable software. It's the kind of value proposition you'd want to highlight in a consulting services proposal.
Pro Tip: Use the "So What?" Test
When you’re brainstorming KPIs, challenge every suggestion with the "So What?" test. Ask it at least three times to get to the real business impact.
"We should track our ticket response time." -> So what?
"So we can answer customer questions faster." -> So what?
"So customers feel heard and are more likely to renew their contracts." -> Bingo. You just connected a team activity directly to a core business outcome: retention. That’s a powerful KPI.
With these co-created KPIs in your pocket, you've built the foundation. Now you're ready to build a system that makes tracking them feel less like big brother and more like a shared scoreboard.
Building Your Performance Measurement System
So, you've nailed down your KPIs. That’s a huge first step. But now comes what feels like an even bigger challenge: how do you actually track everything without getting buried in spreadsheets and busywork?
The secret is to stop thinking about this as more reporting. Instead, think of it as creating a lightweight, continuous feedback loop. Your goal should be a system that delivers ongoing insights with minimal effort, not another tedious task on your to-do list.
Step 4: Move from Annual Reviews to Real-Time Data
Let's be honest: the annual performance review is dead. The modern workplace moves way too fast for a once-a-year conversation to have any real impact. This move toward continuous feedback is what really separates high-performing teams from the rest. It changes performance measurement from a tool for judgment into a tool for genuine development.
Step 5: Automate Data Collection and Visualize Progress
The most effective way to maintain a continuous feedback loop is to automate data collection wherever you can. Find tools that plug right into the software you already use—like your CRM or project management platform—to pull data automatically into a central dashboard. This completely eliminates manual data entry, which not only saves a ton of time but also cuts down on human error.
For instance, a tool like growlio is designed to centralize this entire process. Its dashboard gives you a visual snapshot of progress toward your key goals, all in one place.
This kind of transparency allows everyone on the team to see exactly where projects stand, fostering accountability and a shared sense of ownership. A shared dashboard and quick, weekly 15-minute check-ins can replace big, stressful quarterly reviews, allowing teams to course-correct instantly.
If you want to dig deeper into the nuts and bolts of this, check out this comprehensive guide on how to measure team performance.
At the end of the day, the best systems are the ones people actually use. By focusing on a lightweight, real-time approach, you’re not just tracking numbers—you’re building a sustainable process that fuels continuous improvement.
Turning Performance Data into Actionable Insights

So, you've done the heavy lifting. Your measurement systems are in place, and the data is finally rolling in. But as you stare at a dashboard packed with charts and figures, you're probably asking yourself, "Now what?" It’s a common roadblock. Collecting data is just the first step; the real magic happens when you turn those numbers into meaningful action.
Here’s a simple mindset shift that makes a world of difference: stop looking at metrics in a vacuum. The most potent insights don't come from a single number but from understanding the story behind the numbers and how they influence one another.
Step 6: Look Beyond the Surface Numbers
A single KPI rarely paints the full picture. Let's say you notice a sudden dip in your team's productivity. It's easy to jump to conclusions about performance, but digging deeper is where true leadership begins. Context is everything.
Was the team just handed a complex new project? Did a key person take an unexpected leave? These factors provide the crucial "why" behind the data. This shifts your role from being a data-watcher to a performance coach, allowing for supportive conversations centered on growth, not just judgment.
Key Takeaway: Data without context is just noise. Your job is to find the signal in that noise, connecting performance metrics to the real-world events and challenges your team is facing every day.
Mini Case Study: The Overachieving Support Team
I once worked with a customer support manager who saw her team's 'average handle time' per ticket slowly increasing. Naturally, her first thought was that the team was getting less efficient, and her higher-ups were thinking the same thing.
But before sounding any alarms, she looked at the other data points. It turned out the team's 'first-contact resolution' rate had jumped by 15%, and their customer satisfaction (CSAT) scores were the highest they'd ever been.
The team wasn't slower; they were being more thorough. They were solving complex customer issues on the first try, which ultimately created happier, more loyal customers. This insight prevented a misguided push for speed and instead, the team was celebrated for their commitment to quality. It's a perfect example of using data for smart business process improvement methods.
Step 7: Find the Hidden Connections in Your Data
You don't need a Ph.D. in data science to find these powerful connections. A great starting point is simple correlation. Just put two different metrics on the same timeline and see what you find.
Does an increase in team training hours lead to a lower error rate the following month?
When the team creates more internal knowledge base articles, does it speed up onboarding time for new hires?
Finding these kinds of relationships is how you learn which activities actually drive your most important outcomes. It helps you focus your time, budget, and coaching where they will have the biggest impact.
What's Missing When Performance Metrics Aren't Enough?
Ever get that nagging feeling that something’s off? You're meticulously tracking all the "right" performance metrics—project velocity, quality scores, ticket closures—but the team’s energy just isn't there. Initiative has flatlined, and the spark seems to have gone out.
This is a classic blind spot. Leaders get laser-focused on the what (the output) while completely overlooking the who (the people driving that output). The quickest way to get a more complete picture is to start measuring employee engagement.
Step 8: Measure Employee Engagement as a Hard-Hitting KPI
Let's be clear: engagement is far from a fluffy, feel-good concept. It's a direct predictor of productivity, quality, and retention. Disengaged employees don't just coast; their apathy can poison team morale and actively sabotage results.
The data is pretty stark. Right now, only 23% of employees around the world are actively engaged at work. This disconnect isn't just a shame—it has a real, tangible cost that shows up in everything from daily output to your turnover rate.
Mini Case Study: The Agency That Lost Its Spark
I once worked with a mid-sized digital marketing agency that was obsessed with data. They tracked every KPI you can imagine: client ROI, project profitability, billable hours. On paper, they were crushing it. But behind the scenes, they had a baffling retention problem, losing some of their best people every few months.
They decided to try something new: simple, anonymous pulse surveys sent out every two weeks using structured employee engagement survey templates. The feedback was a gut punch. People felt like cogs in a machine, lacking any real ownership over their projects and receiving almost no recognition.
With this new insight, the leadership team made two strategic changes:
They empowered campaign leads with the authority to make creative decisions on the spot.
They kicked off a weekly all-hands meeting specifically to celebrate individual and team wins.
The result? Within six months, voluntary turnover was cut in half. And, not surprisingly, client satisfaction scores started climbing as happier, more empowered employees produced better work.
You can’t ignore the link between engagement and retention. Highly engaged employees are a staggering 87% less likely to leave their companies. Think about what that means for your bottom line when you factor in the high costs of recruiting, hiring, and training.
An Expert Tip for Deeper Insights
Don't stop at just measuring engagement. You need to measure its key drivers. When you send out those pulse surveys, go beyond a simple "How engaged are you feeling?" question. Get specific.
Ask about the things that are known to fuel engagement:
Autonomy: "I have the freedom I need to do my job effectively."
Recognition: "I feel seen and valued for my contributions."
Psychological Safety: "I feel comfortable taking risks and sharing different opinions within this team."
When you track these underlying factors, you can stop guessing and start targeting the exact areas that will boost both engagement and, ultimately, performance.
Ready to stop guessing and start building a truly high-performing, engaged team? You can start today by defining and tracking your team's most important goals in one simple platform.
Ready to Build a Higher-Performing Team?

It’s easy to get stuck when you have a gut feeling about team performance but no clear data to back it up. The biggest shift happens when you realize measuring team performance isn't about watching over everyone's shoulder. It's about giving your team the clarity and tools they need to knock it out of the park.
We've just walked through a real-world approach to get past those vague, unhelpful metrics. You now have a solid framework for defining what success actually looks like, setting up a simple measurement system, and using that data to help your team grow. Get this right, and you'll see a major increase team productivity and a genuine boost in morale.
The next move is yours. Don't get bogged down trying to build the perfect system from day one. Start your free growlio account now and begin defining and tracking the goals that truly matter to your team, all in one straightforward, effective platform.
Got Questions? We've Got Answers
Putting a new performance measurement system into practice always brings up a few questions. It's completely normal to wonder about the nitty-gritty details as you move away from old habits. Let's tackle some of the most common hurdles managers run into.
How Often Should We Actually Talk About These Metrics?
Forget the old-school, once-a-year performance review. That model is broken. For most teams I've worked with, a bi-weekly or monthly check-in hits the sweet spot. It's frequent enough to catch emerging trends and make course corrections before things go off the rails, but not so often that it feels like you're micromanaging.
If you’re on a particularly fast-paced project, a quick weekly sync focused only on the most critical numbers can be a game-changer. The real goal here is to create a consistent, two-way dialogue, not just to read numbers off a spreadsheet.
What's the Real Difference Between a KPI and a Metric?
This is a fantastic question, and the distinction is vital. Think of it like this: a metric is simply a number you can track. It’s data. For instance, the number of sales calls your team makes in a day is a metric.
A Key Performance Indicator (KPI), on the other hand, is a metric you’ve specifically chosen because it directly reflects progress toward a major business goal. While you might track dozens of metrics, you should only have 3-5 KPIs—these are the true vital signs for your team's success.
All of your KPIs will be metrics, but very few of your metrics will ever be important enough to become a KPI. Knowing how to choose the right ones is what separates a focused, effective team from one that's just busy.
How Can I Measure Performance for Creative or Less "Number-y" Roles?
This is where you have to get a bit more creative yourself. Measuring performance for roles that aren't purely quantitative is all about shifting your focus to qualitative and behavioral indicators. Instead of trying to count the 'number of designs created,' you need to measure things that point to quality and real-world impact.
Here are a few ideas that have worked well for teams I've managed:
Stakeholder satisfaction surveys: After a project wraps up, send a short survey to key stakeholders to gauge their experience and satisfaction.
Revision rounds: Track the number of revisions required for a project. Fewer revisions often mean the initial brief was better understood and executed.
On-time, on-budget delivery: Measure adherence to project timelines and budgets. This is a solid indicator of efficiency and planning.
You can also incorporate 360-degree feedback or self-assessments that look at things like collaboration, innovation, and problem-solving. It's all about defining what "great" looks like in that specific role and then finding smart, tangible ways to track it.